Tuesday, July 3, 2018

Establish Mathematics Goals to Focus Learning

If you have read NCTM's "Principles to Actions," then you are familiar with the Mathematics Teaching Practices. These practices, "provide a framework for strengthening the teaching and learning of mathematics. (NCTM, 2014, p.9) If you are not familiar with "Principles to Actions" and the Math Teaching Practices, I suggest you look into them. They really do have the power to transform your teaching.

Although all of the Math Teaching Practices are important, I find the first practice, "Establish mathematics goals to focus learning," to be the most important for me to be mindful of when planning a lesson. While important, it is also the most challenging portion of the planning process. Here are the steps I take.

Step 1: Read the Standard
I mean, REALLY READ THE STANDARD! The standards are very dense and can be difficult to make sense of. I read them closely and look for parts. Lets look at a 6th grade standard.

Understand the concept of a ratio as comparing two quantities multiplicatively or joining/composing the two quantities in a way that preserves a multiplicative relationship. Use ratio language to describe a ratio relationship between two quantities. For example, "There were 2/3 as many men as women at the concert.”

I see two parts. 1) Understand what a ratio is and that it can be extended. 2) Describe ratios using appropriate ratio language (this includes written formats). At first glance, this seems pretty straight forward. Caution is needed here as understanding ratios and seeing the multiplicative relationships within them can be difficult. So although it is only 1 sentence in the standard there is a lot of intricacy in what students need to understand. However, this blog is about writing mathematical goals, so I am not going to dig deeper into that but does illustrate my point about really reading and thinking deeply about the mathematics that is the focus of the standard.

Step 2: Consult the AZ Performance Level Descriptors & Item Specifications
You can access these documents here for grades 3-5, here for grades 6-8 and here for End of Course standards (Alg. I, II, and Geometry). These two documents have become "go to" resources for me. They clearly define what students should be able to do and give some insight into what is basic understanding and/or skill and what is full understanding and/or skill. They provide information about number sets that should be included as well.

From the Performance Level Descriptors we see the following information.

save image

As I read across the columns, I can begin to get a sense of what the standard is expecting students to not only do, but what the understanding expectations are. Generally, there are multiple ideas that students are to understand but I can begin to determine where my focus will lie. What sticks out to me is that students are to "connect between representations for ratio situations."

Here is the item specification information for the standard.

save image

This document contains a lot of information that is helpful in thinking about the mathematical goal. There is a lot of emphasis on using language and describing. I also notice what representations students will be expected to use in the "Sample Task Demands" section. For this standard, tape diagrams and double number line graphics are specifically mentioned. This can also be helpful as you think about the mathematical goal. The "Recommended Math Practices" can also be considered when writing math goals.

Step 3: Consult other resources if needed
At this point, I might refer Acheive the Core's Coherence Map which can help when building on previous understanding or preparing for future understanding and/or skills. I will continue to consult resources if I am unclear on the standard.

Step 4: Write the mathematical goal
I will then take a stab at writing a mathematical goal. For this standard, there are a lot of mathematical goals that are appropriate, depending on the experience that students have with ratios. If students have little experience with ratios I might start with "students will understand that a ratio can be a part to part relationship or a part to whole relationship." Or, "students understand that a ratio is a multiplicative relationship and that this relationship can be extended to larger or smaller quantities." If I decide to focus on representations, the math goal might be "Students will understand that double number lines and tape diagrams can be used to extend ratios."

Once I have my math goal, I can begin to build an effective task based lesson. The goal keeps me on track and ensures that I assess for the correct understanding during the lesson. I choose better task, ask better questions and am ultimately a better teacher when I use this process.

I'd love to hear what your thoughts are and what process you use to write math goals in the comments.


Principles to Actions: Ensuring Mathematical Success for All. NCTM, National Council of Teachers of Mathematics, 2014.


Friday, June 10, 2016

My Favorite No

"My Favorite No" is a low-stakes, quick activity that has several benefits for student learning. Here's how it works.

  • The teacher presents a problem to the class
  • The students solve the problem to the best of their ability on a note card
  • The teacher collects all note cards
  • The teacher sorts the cards into two piles - one for "no" or incorrect answers and one for "yes" or correct answers
  • The teacher chooses one or two of his/her "favorite" no's and displays them using a doc cam
  • The class discusses the "no" and what mistake(s) was/were made
    • First ask students what was done correctly
    • Then ask what mistake(s) was/were made
  • Note: students should not put their names on the cards
  • Note: the teacher may copy the students work onto a note card under the doc cam - doing so brings more anonymity to the activity by hiding handwriting, color pen, etc.
Watch this video to see how Leah Alcala uses "My Favorite No" with her students.


The "My Favorite No" is a great way to begin a class or could be used as a check for understanding activity. With some practice it could be used on the fly when a teacher feels the need to see how the students are doing. However, carefully selected questions will reveal more student misconceptions. 

Here are some of the benefits that I see of using this strategy.
  • It allows the teacher to quickly check for understanding and misconceptions. Quickly gathering this information is a vital part of the learning process. The information that is revealed will help the teacher where to go next.
  • "My Favorite No" encourages students to use the language of mathematics. As students discuss the solution the teacher will ask them to support their claim with what they are seeing using precise language in order to clearly state their claim.
  • The process demonstrates the value of mistakes. As in life, mistakes in math can lead to improved understanding and are vital to the learning process. Mistakes should be valued as opportunities to learn and gain insights. "My Favorite No" is one piece of building this atmosphere in the classroom.
  • Students will engage in multiple Student Mathematical Practices during the "My Favorite No" activity. They will be critiquing the reasoning of others as well make viable arguments (SMP 3). While doing this they will attend to precision, both in calculation and in defending their statements using mathematical language (SMP 6).
As I watched the video I made one observation. During discussion I would ask students to turn and discuss what they see with a shoulder partner thus engaging more students in conversation about the problem. 

What modifications would you make? Leave your ideas in the comments.


Friday, June 19, 2015

Little Kids Math - Scary!

Recently my job description has changed a bit. Because of the ongoing financial challenges that almost everyone in education is dealing with, my job description has changed a bit. Currently, I am work with middle and high school math teachers. Soon our primary math specialist will be leaving due to budget reasons, leaving me as the math specialist. Scary!

My personal experience in the classroom is limited to middle school and up. I am certainly not a math expert, but feel I have a pretty good handle on the content of middle and high school math as well as understand enough about the students to be helpful. The thought of being in a classroom of 20+ 6 year-olds, makes me want to run away screaming. The closest experience that I have to working with such a group of kiddos is playing with and being Dad to our 4 year old son. Not really what one would look for during the hiring process.


In order to ease my anxiety I have been studying the content of the elementary grades. I will tackle classroom management strategies later and will be relying on my wife's experience as a 2nd grade teacher, the expertise of some friends, and my PLN to get a handle on how to maintain control of an elementary classroom. 

So far I have spent 2 days learning about computational fluency with K-2, read most of "Introduction to Problem Solving by Susan O'Connell, written a detailed 1st grade lesson on adding and subtracting, and closely studied the 4th grade math standards. I have learned a bunch and really am amazed at how much I have enjoyed this learning experience. What I find most fascinating is the idea that the standards really do seem to be addressing some challenges that I have personally experienced with high school students. I often observe such gaps in students understanding of the structure of numbers that it interferes with completing more complex tasks. So many patterns and relationships exist within numbers that one could spend a lifetime discovering new patterns. Pretty cool and amazing stuff. I really do see how the AZCCRS emphasize helping students learn how numbers work together.

Another thing I have enjoyed is being able to read the standards and actually understand what they are asking for students to be able to know, do, and understand. Ever read the AZCCRS math standards for high school? It's kind of like watching Jeopardy for me. 90% of the time I have no idea what the question (or I guess answer) is looking for, but recognize something about 10%. The high school standards are super dense and difficult to read. It takes a very focused effort and some review to make sense of these standards. Perhaps it is because of my experience and knowledge, but the elementary standards seem pretty straight forward. It makes me smile!

I get really excited when I see what students are doing in the lower grades because it will be such a benefit to the students as they encounter more difficult and complex topics. Understanding what the equal sign means and how numbers can be decomposed, rearranged, and put back together is an invaluable skill that can not be emphasized enough.

Although I am nervous about my credibility with elementary teachers I am very excited for the chance to learn from them and expand my knowledge about teaching math to students of all ages. Can't wait to see what is next.


Friday, April 17, 2015

Use Desmos for Least Squared Lines and Regressions

Graphing calculators are great. They do everything that I have ever needed plus a whole bunch of things that I have never needed. They certainly have their place in the classroom. However they have their limitations. Students can find the navigation frustrating and it is sometimes really hard to see the graphs. Zooming in and out can be cumbersome and finding key points quickly requires a less than simple process.

Enter Desmos. If you haven't used Desmos take some time to mess around with it. Desmos is a web-based graphing calculator. It's a great tool and easy to learn. A couple of weeks ago I had a few spare minutes during a tutoring session. The students were working on determining the least squared line of a set of data using TI-83 calculators. The students were struggling with changing the viewing window and finding the equation of the least squared lines. I turned to Desmos to provide some clarification.  A quick search confirmed that Desmos does regressions. Beyond that you can put the data, the line (or parabola, or whatever) and the residuals graph on the same coordinate plane so that students can really see the relationship between the two. Here's how.


Step 1:
Enter the data. This can be done as a series of ordered pair or by adding a table (To add a table click the + at the top left of the screen and then choose "table.") If you have the data in a spreadsheet, simply copy and paste it into Desmos. Desmos will automatically put the data into a table for you.
Here is the data that I used.


Length Time
53
1.43
63
1.53
73
1.67
83
1.76
93
1.93
103
1.98
113
2.08
123
2.21
133
2.28
143
2.38
153
2.43

And here is what it looks like in Desmos.


Notice that you can not see the data. 

Step 2
To see the data, simply zoom out or click on the wrench to access the graph setting where you can choose the viewing window by adjusting the minimum and maximum values for the x and y-axes. Watch the video to see how to do this.


Here is what my graph looks like now.


Step 3
Now we are ready to find the least squared line. Since the graph appears to be linear I will do a linear regression.
Enter the following equation into Desmos
y1~mx1+b

This tells Desmos to pull the data from the table. The "~" indicates that it is an estimate. After this is entered the least squared line will be visible and information about the correlation will be displayed.


It appears at this point that the line closely correlates to the data. The r2value is very close to 1.

Step 4
To confirm that a linear model is the best fit for this data we can use the residuals graph. To create the residuals graph first simply click the "plot" button under residuals in the information about the least squared line. Boom! The residuals plot is automatically created and a column with the residuals is added to the table.


If we look closely at the residuals plot it appears that all the points at the end are below zero while the points in the middle are above. This would indicate that perhaps a linear model would not be good for lengths outside of our data set.

Desmos is not the only way to create this plot. However, the ease of use makes it a good tool for teachers to use when discussing graphs and data. Being able to quickly create graphs can help teachers lead great discussions with students. These graphs can also be saved and shared with students through email or share a link to your graph. Click the link below to see the graph I created for this post.


Enjoy and happy graphing!

Friday, March 27, 2015

Force a Copy in Google Docs

A cool trick that I just learned and has made my life easier. There are times when I want to have participants create their own copy of a Google Doc. This can be a cumbersome experience for those that are just starting with Google Docs. I can imagine with younger students, this can also be a bit of a challenge and take some training. I do not have access to classroom and it really wouldn't be very practical to use in most circumstances. Forcing a copy has helped me overcome some of these hurdles.

1. Open the document


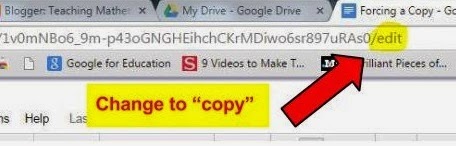
2. In the address bar change "edit" to "copy"


3. Create and send short link

When the link is opened by someone else they will see a screen similar to the following. They are forced to make a copy to their drive in order to open the document and you are ensured that no one can make changes to your original document.